|
|

|
|
|
|
| |
|
|
|
|
| |
 |
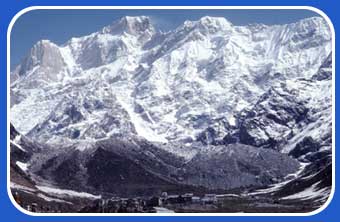
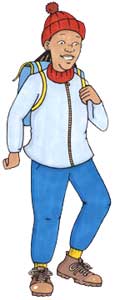
High
in the Himalayas, the climate is very harsh.
For every thousand metres you go up, the temperature
falls by an average of 6.5°C. Think how
cold it would be in these mountains! Also,
there is less oxygen in the air up here
if you are not used to it, the thin air makes
it more difficult to breathe. |
|
|
|
|
|
|
|
|
|
|
| |
 ©Borje
Tobiasson/Panos Pictures
©Borje
Tobiasson/Panos Pictures |
|
|
|
|
|
|
|
|
|
| |
| In the
hills and valleys lower down, it is a different
story. Here, the temperatures are warmer and
the monsoons
make a big difference. The monsoons
are actually winds that carry lots of moisture
picked up from the ocean. When they blow across
the region between June and September, the
rain comes in bucketfuls. |
 |
 |
The
Himalayas block the path of the monsoons
so some parts of the north-east region get
even more rain during monsoon
season. One town here called Cherrapunjee
became famous for being the wettest place
on earth. People who live in Cherrapunjee
have to cope with 12 metres of rain in a year,
fifteen times more than we have in this country! |
|
|
|
|
|
|
|
|
|
|
| |
|
|
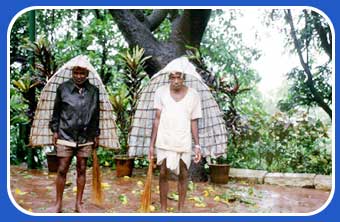
| To
cope with the wet season, people need to be
prepared. How are people keeping themselves
dry in the photo? |
|
|
|
|
|
|
|
|
|
| |
 ©
Fram Petit/Panos Pictures
©
Fram Petit/Panos Pictures |
|
|
|
|
|
|
|
|
|
|
| |
| During
the monsoon
season the rain washes away a lot of the
valuable soil off the fields around Cherrapunjee.
To make new soil, local people mix together
food left-overs and animal manure. |
 |
|
|
|
|
|
|
|
|
|
|
| |
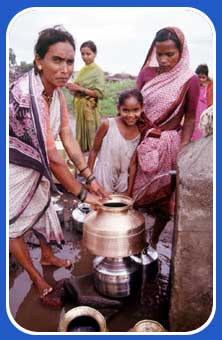
 Outside
the monsoon
season, the people of Cherrapunjee have to
live with drought.
During these months, local people have to
collect water from a pipeline, their only
supply of water. Outside
the monsoon
season, the people of Cherrapunjee have to
live with drought.
During these months, local people have to
collect water from a pipeline, their only
supply of water. |
|
|
|
|
|
|
|
|
|
|
| |
 ©Jimmy
Holmes/Panos Pictures
©Jimmy
Holmes/Panos Pictures |
|
|
|
|
|
|
|
|
|
|
| |
 |
Imagine
you were spending a whole year in Cherrapunjee
what would you pack so you could cope
with the extremes of the different seasons? |
| How
does the rainfall here compare with other
parts of India and places in the UK? |
 |
 |
 to
find a spreadsheet showing rainfall
in different places so you can find
out for yourself. To compare the different
places, you can create block graphs
to show the rainfall patterns. to
find a spreadsheet showing rainfall
in different places so you can find
out for yourself. To compare the different
places, you can create block graphs
to show the rainfall patterns. |
If
you need help with this,
to print out some tips on making graphs
from spreadsheets. |
|
|
|
|
|
|
|
|
|
|
|
|
|
|
 |
 |
|
|